


 Dans la journée, vieux, les développeurs Web doivent utiliser Flash ou les langages de programmation côté serveur pour créer le graphs/graphiques, Pour cause de raisons beaucoup. JavaScript cadres, Nous sommes capables de créer les graphiques facilement, et prendre moins de nos ressources.
We had shared a lot of useful resources about CSS/jQuery recently. Today, I am going to share useful resources and plugins to create a stylish chart. Graph and Chart are very effective ways of showing data.
There are a lot of different methods to generate graphs/charts. For example, you can use Flash, Javascript, CSS, or server side script such as PHP or ASP to generate them. Today, we are going to look into Javascript solutions to generate charts.
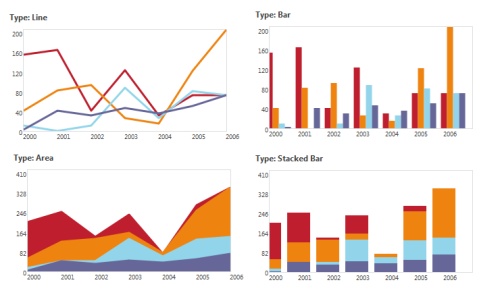
This article show you how to use fgCharting, a jQuery plugin to convert
HTML table into a stylish chart/graph. This plugin support several
different types, such as line, filledLine, additiveLine,
additiveFilledLine, pie, bar, additiveBar.
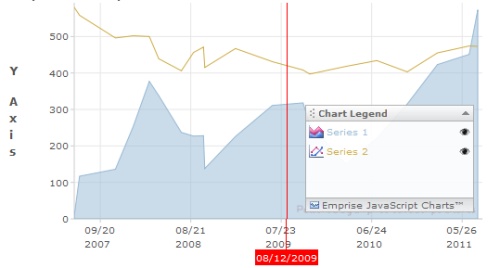
This JavaScript Charts supports a lot of features and has a very good documentations. However, it is only free for personal use.
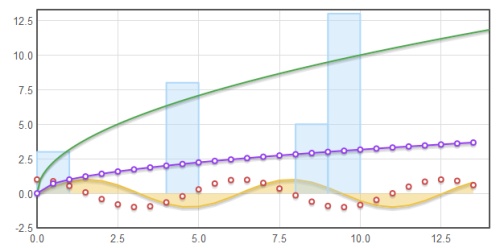
Flot is a pure Javascript plotting library for jQuery. It produces
graphical plots of arbitrary datasets on-the-fly client-side. The focus
is on simple usage (all settings are optional), attractive looks and
interactive features like zooming and mouse tracking.
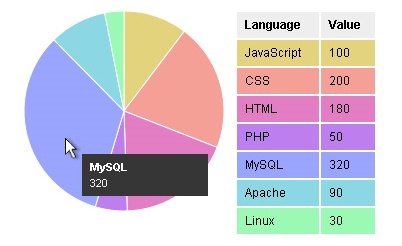
This Mootools pie chart class is based on Stoyan Stefanov's Canvas Pie.The code now requires less html markup than the original.
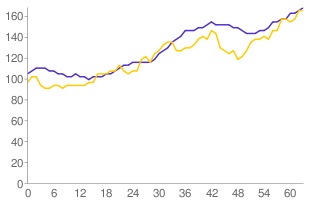

This jQuery plugin generates sparklines (small inline charts) directly
in the browser using data supplied either inline in the HTML, or via
javascript.
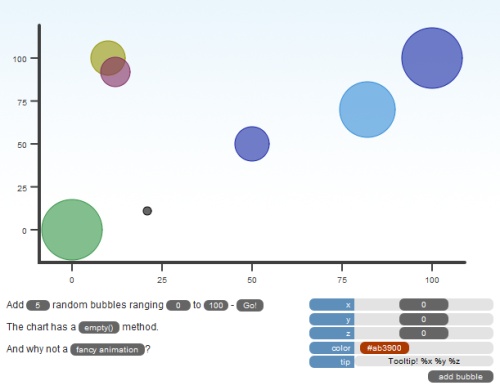
moochart is a plugin for MooTools 1.2 that draws bubble diagrams on the
canvas tag. Future versions might include pie, bar & line graphs.